
Infrographic
The Brief
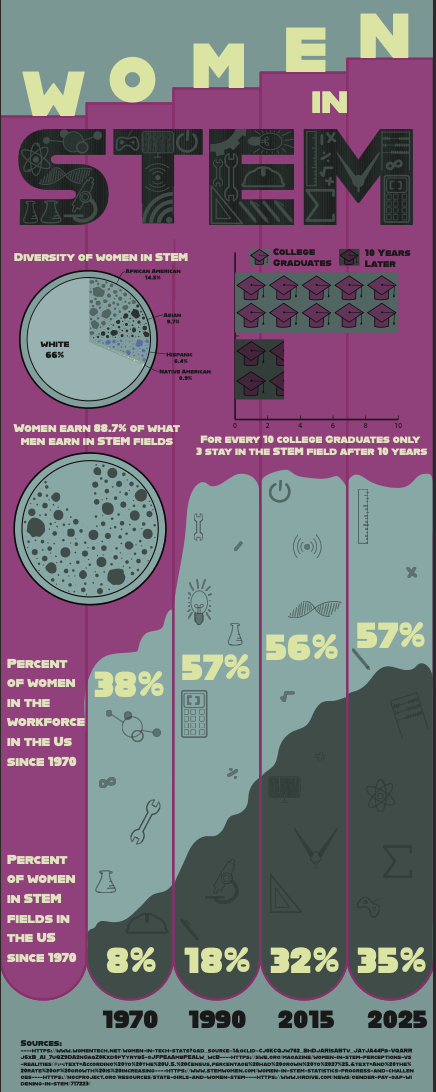
Create an infographic that tells a story with data that you find interesting and informative. Your infographic must contain at least five instances of data to portray different aspects of the information presented.
My Interpretation
I chose the topic Women in STEM because I feel like women need to have opportunities in careers that have been predominantly male-dominated in the past. My data showed how the percentage of women has been rising over the past 50 years. I found it really interesting how much the stem feields have been rising in popularity, yet there are still large discrepancies in percentages.
Animated
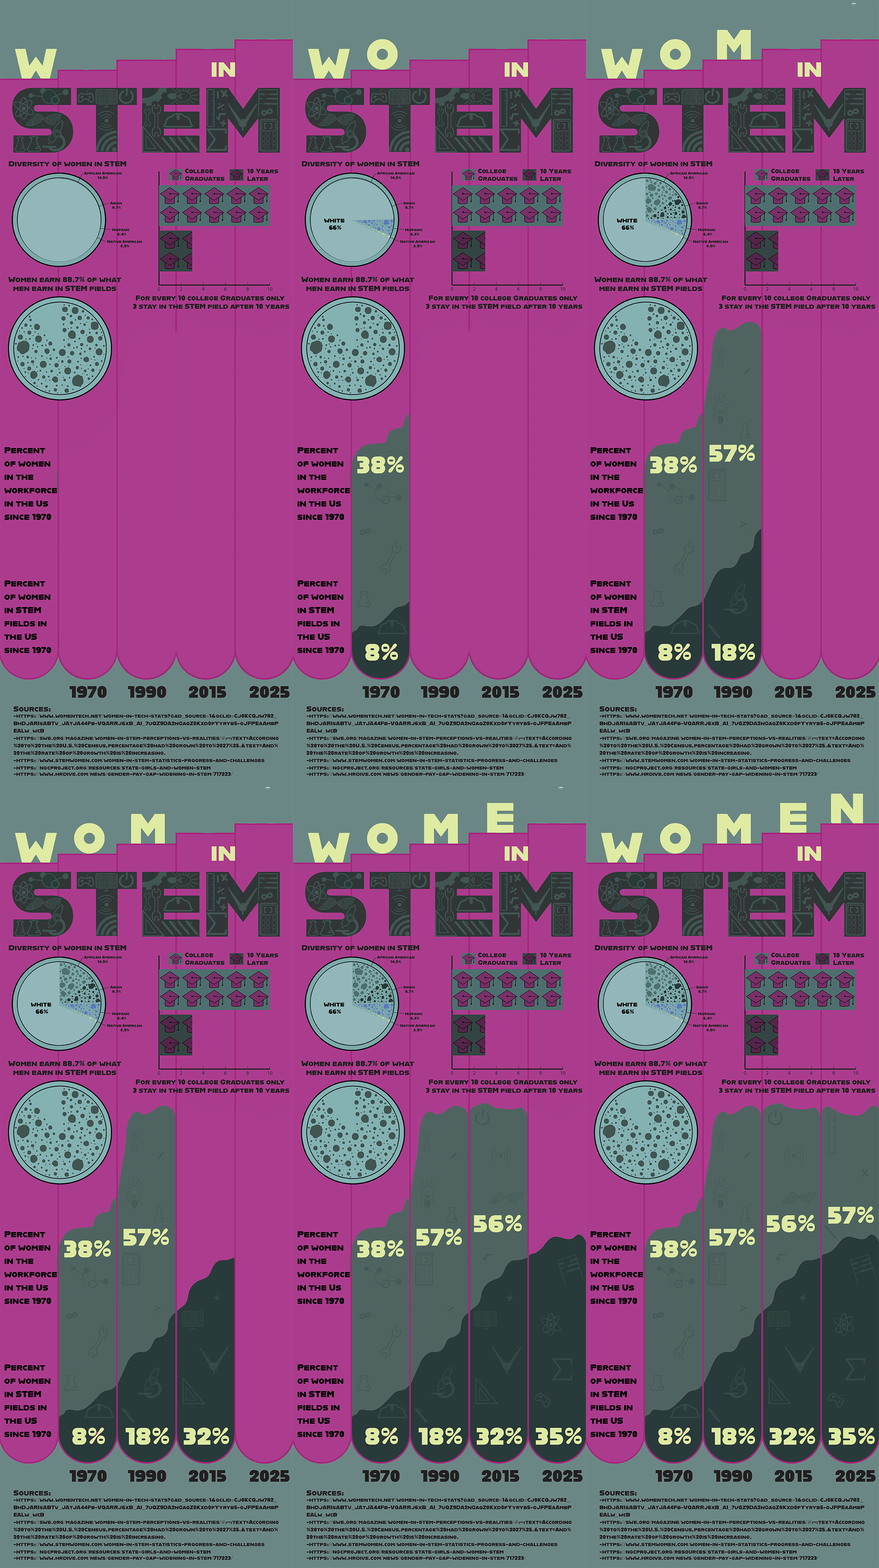
For the animated version, because the main elements in the back are supposed to be test tubes, I wanted to make them look like they are filling up with the data and percentages. I also put some of my data on plates to make them look like growing colonies and bacteria. I picked a blue that I felt was very computer-like and contrasted that with a pink as a styereotypical women color.